Tracing VerneMQ with the erlyberly tool
We have been asked to include more debug logs in VerneMQ. We'll do that in a next release (it's all nicely included already, but we just don't call lager:debug that much). The reason for that is simple: In an Erlang system you mostly use tracing not debug logging. Now you're scared because you heard that
- Erlang tracing is complicated and
- it gives you superpowers by which you can easily kill your production system.
TRUE! (ehehehehe)
We won't go into details here on how to do it the right way use recon, eper, redbug and all that stuff.
But we found erlyberly today, an Erlang tracer/debugger GUI. After a (very quick) check, we found that it probably works with VerneMQ and might prove useful to some of our users.
So let's have a look:
➜ ~ history | grep 'erlyberly\|setup'
1330 git clone https://github.com/andytill/erlyberly.git
1332 cd erlyberly
1334 ./setup.sh
1339 java -jar erlyberly-0.6.7-jar-with-dependencies.jar
OK, now you should see the erlyberly GUI. We have a VerneMQ server running on localhost and throw a couple of messages at it with some test configuration.
So the next step is to actually connect erlyberly to VerneMQ:
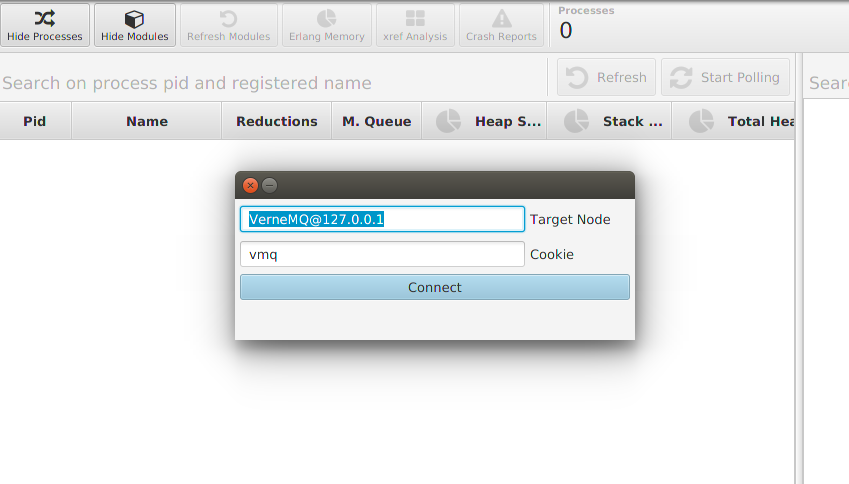
There are 3 window areas: Processes, Modules and the Trace Log area. Hide the processes for now (by clicking the leftmost "Hide Processes" button).
In the module area, you'll see a list of all the loaded modules. If you expand a module, you'll see all it's functions. The non-exported functions are marked with a closed padlock symbol (you can trace exported and non-exported functions). Hit "Refresh Modules" if you don't see the vmq modules.
OK, before you continue: remember this key combination: CTRL + T (we're on Linux here btw). That's CTRL+T, not CTRL+Shift+T!! You can start and stop tracing a function with that. You can right click on a function, to see what else you can do, but
- DON'T do "trace all" for now. (yeah... CTRL+Shift+T...)
- DON'T use the sequential trace for now.
To generate a sample for a function that is heavily called, it's enough to just hit CTRL+T 2 times. You'll get a feeling for that very quickly! :)
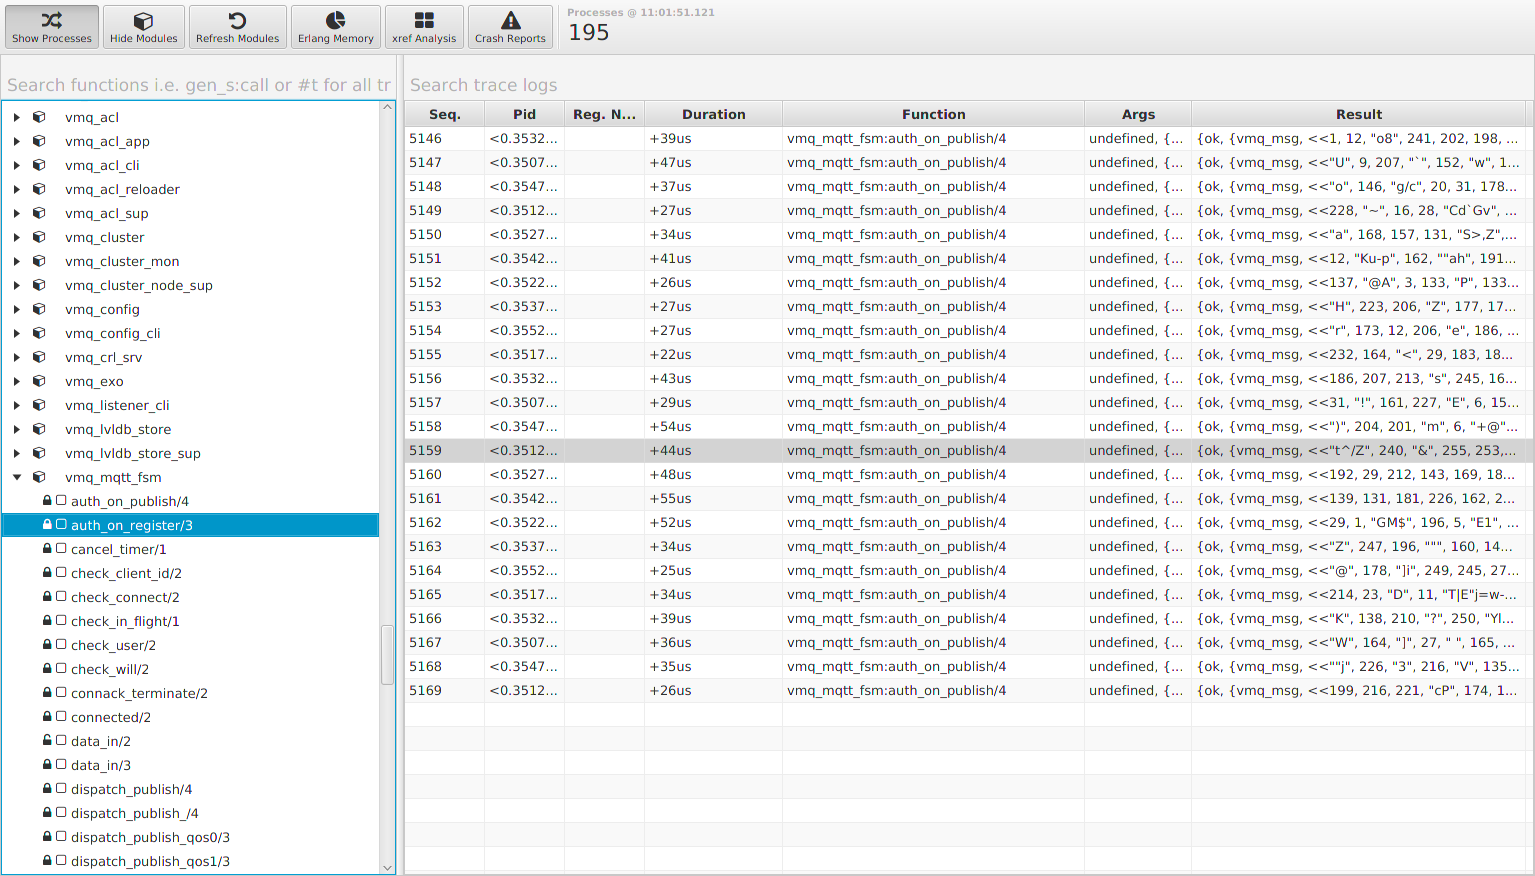
You can't set your own proper trace patterns, but you can use the filters, i.e the search fields to limit the shown results automatically, by typing something in the "search trace logs" field above the trace log window. There should be a CLEAR button, but it doesn't show up in my version of erlyberly. But you can right-click on any row and select "delete all".
Go through a couple of functions. To quickly see, if a function is called at all, do the 2 times CTRL+T trick. Some functions might yield no trace results, they are not called at the moment. Trace the functions in vmq_parser and vmq_mqtt_fsm to get a feeling what happens while you send messages to VerneMQ. Explore!
Double-click on a row in the tracer window, to see function arguments and results in more detail. In the trace results, there's also a duration for that function call. Tell us if you find some slow fellows there! You still need some internal knowledge of VerneMQ to narrow down a problem. But we think we just showed you a cheap way to have a lot of fun and actually also learn a couple of things on the way.
We'll show you how you can trace using the Erlang Observer app some other time.
OK, now go shoot yourself in the foot, including "trace all" and "sequential trace"! :) Just... don't do those on your production system...
The VerneMQ Mission Engineers