Monitoring VerneMQ Application Metrics with Grafana
Note: Since this was written, the graphite plugin has become part of VerneMQ and is no longer an external plugin. See the documentation here.
[cue the A-TEAM intro sound...] While VerneMQ had many metrics built in right from the start, we never had the chance to show you how simple it actually is to display those metrics. So we'd like to show you today how easy it is to integrate VerneMQ Release 0.12.0 with Grafana, a powerful dashboard composer that allows you to elegantly explore all the VerneMQ metrics. While we're using only the most basic Grafana features the result of a couple of minutes for Grafana configuration already looks quite impressive: 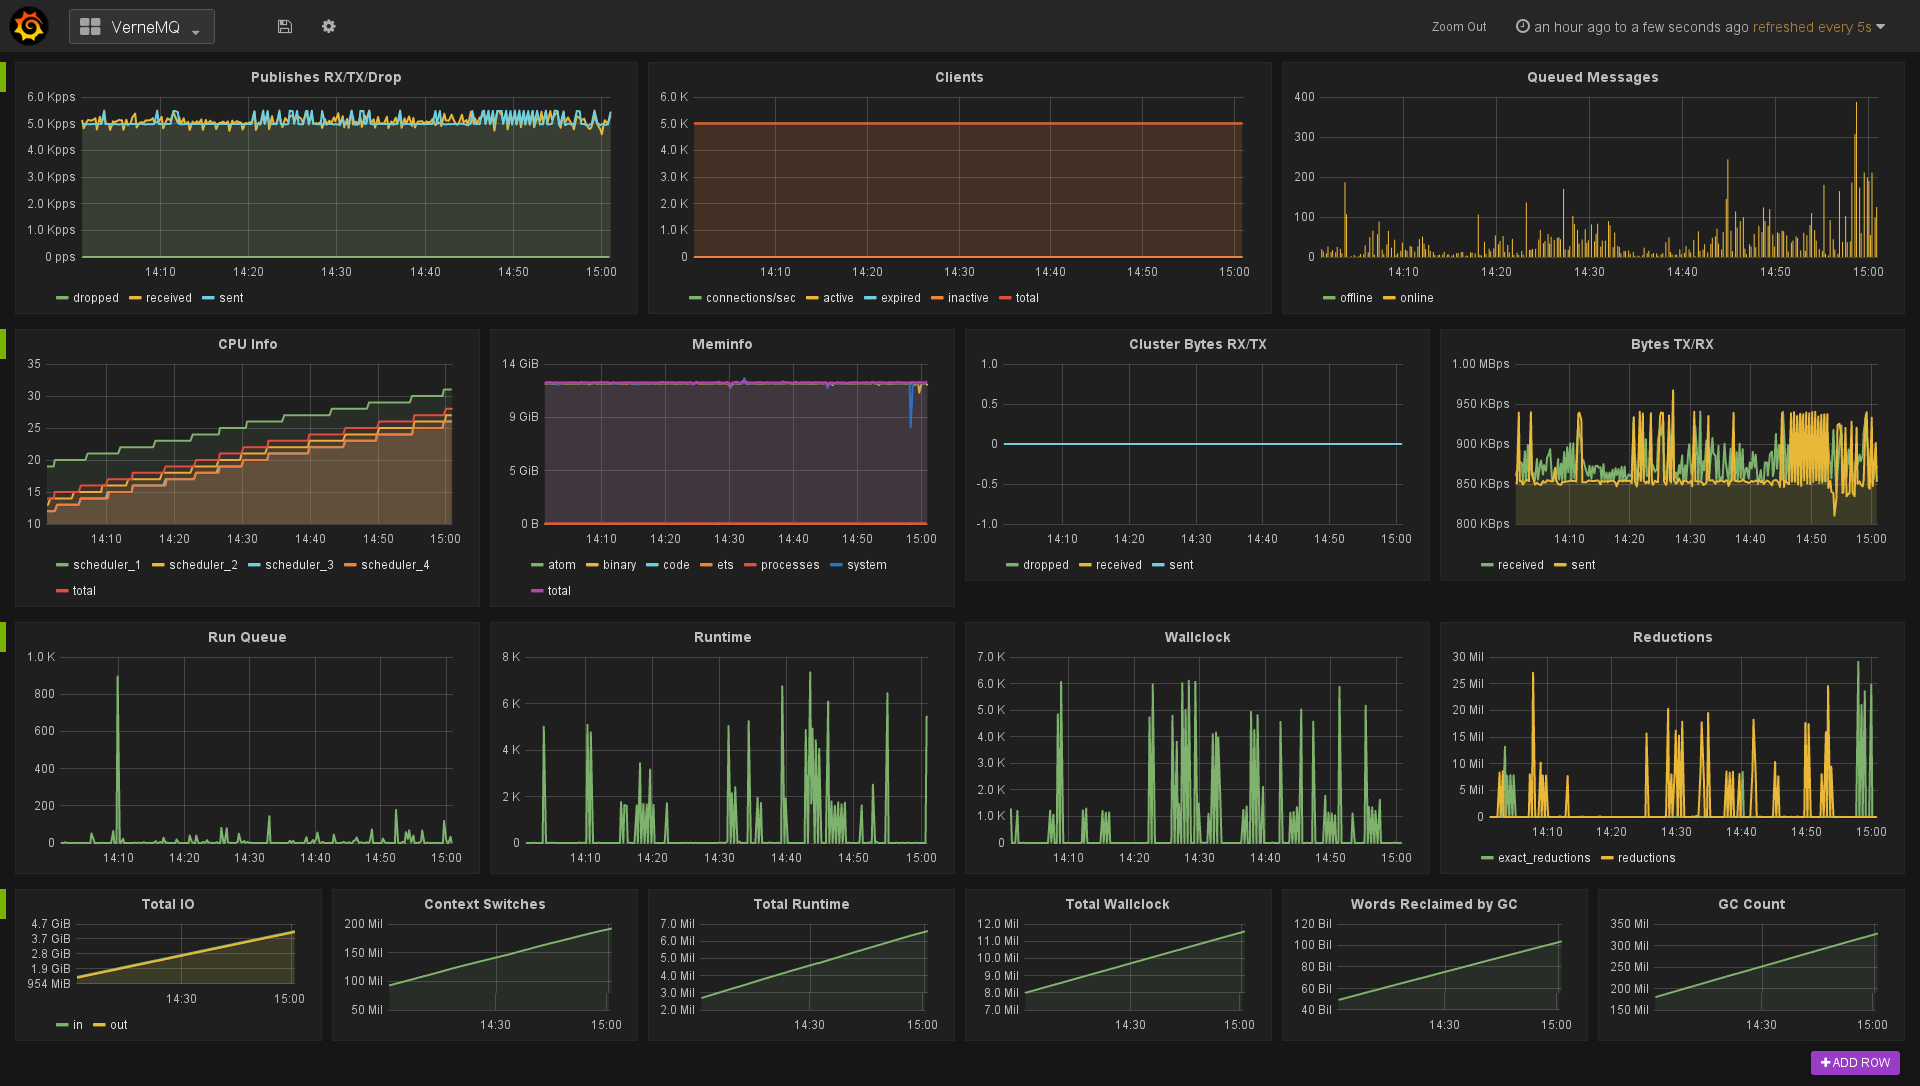
You have all the important metrics on one page. On the top row you can find the nr. of MQTT publishes VerneMQ is currently receiving, transmitting, or dropping. You can also get information on MQTT connect requests and nr. of active, inactive, or expired clients. On the top right you'll find the online and offline messages VerneMQ is queuing. Of course all the typical Erlang VM stats are available too. If you want to experiment with the Grafana dashboard and VerneMQ, you have to go through the following steps:
- Install and configure VerneMQ Release 0.12.0
- Get Graphite and Grafana running. You can use one of the many pre-configured Graphite/Grafana Docker containers. We built ours on this one here: https://github.com/SamSaffron/graphite_docker
- Enable and configure the VerneMQ vmq_graphite plugin:
- Run
vmq-admin plugin enable -n vmq_graphite - Verify that the plugin is enabled with
vmq-admin plugin show - If you use the docker image on localhost, you can leave the config values in vernemq.conf as they are ("localhost" and port "2003"). If not, adapt the values of course.
- Run
- Configure your dashboard or import the one we've created:
- In the Grafana web view, add a Graphite data source as "default" (if you use the docker image, it's "localhost" on port 80)
- Under "Dashboards" -> "Import", load our exported Grafana JSON from Github: https://gist.github.com/dergraf/bcd6eccd82a5f80984af We still have to see how to configure the Dashboard for a multi-node deployment. But looking at the Grafana documentation this looks like a piece of cake.
Have Fun!
The VerneMQ Mission Engineers